More items from wave Monday
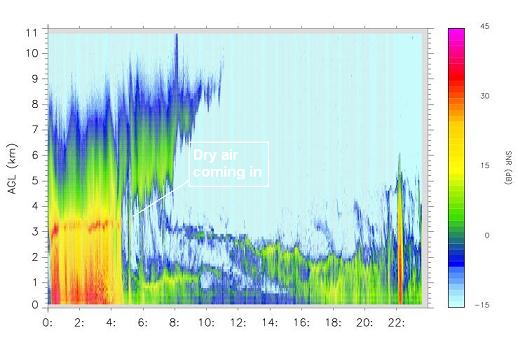
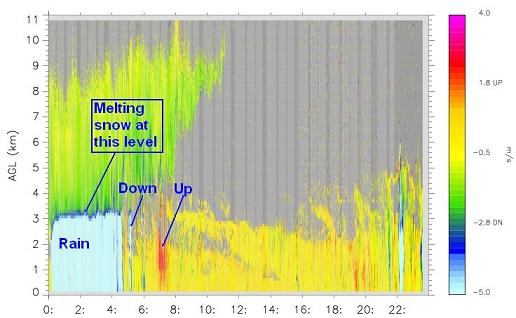
In the long post on the Monday morning gravity wave, I mentioned that the UAH MIPS wind profiler observed the downward and upward motions that caused the rapid changes in surface pressure and therefore the strong winds. Thanks to Dustin Phillips, the tech guru (and meteorologist) who maintains the MIPS system (this guy can write a program and then go out and get diesel on his hands and fix a generator), I have MIPS-generated time-height plots of reflectivity and vertical motion.
Notice the drying of the return at mid-levels on the top image. While it was raining, the downward motion is actually the profiler detecting the precipitation fall speed. Notice how they speed up near 3 km height. That’s where they’re melting from snow to rain and starting to fall faster. The rain ends by 0430 UTC, then the 2 down motions are the descending air causing the wake low pressure area, and then there’s upward motion around 0730 UTC.
Category: Uncategorized


