Welcome to June!
Welcome to the month in which both meteorological and astronomical summer both begin. In case you do not know what the difference between meteorological and astronomical seasons, I’ll try to explain it as best as possible. (Information gathered from the NOAA website, link: https://www.ncdc.noaa.gov/news/meteorological-versus-astronomical-seasons)
ASTRONOMICAL SUMMER: THURSDAY, JUNE 21ST – SATURDAY, SEPTEMBER 22ND
The natural rotation of the Earth around the sun forms the basis for the astronomical calendar, in which we form the seasons by two solstices and two equinoxes. Earth’s tilt and the sun’s alignment over the equator determine both the solstices and equinoxes. Equinoxes mark when the sun passes directly over the equator, whereas solstices mark when the sun is farthest away from the equator. Since the Earth actually takes 365.24 days to travel around the sun, an extra day is needed every fourth year, creating “Leap Year.” This, along with the elliptical shape of the Earth’s orbit, makes the actual number of days in each season to vary between 89 to 93 days. This makes it difficult to compare climatological statistics consistently for a particular season from one year to next. That is why there is a need for meteorological seasons.
METEOROLOGICAL SUMMER: FRIDAY, JUNE 1ST – FRIDAY, AUGUST 31ST
Meteorologists and climatologists group the seasons in three month sections (or seasons) based on the calendar and on the annual temperature cycle. Forecasting and observing led to these seasons being created. Meteorological season length is more consistent between the four seasons as they are close to 90 days for each season. With less variation in start date and in season length, its much easier to calculate seasonal statistics from monthly statistics, both of which are very useful for agriculture, commerce, and a variety of other purposes.
Now, back to June and the infographic.
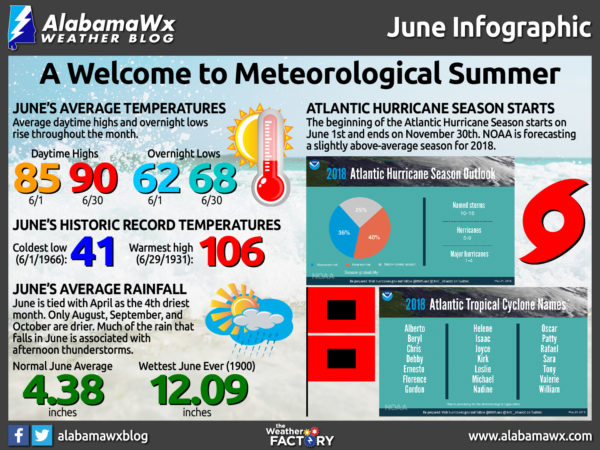
June, for Birmingham, features warm temperatures, increasing humidity and generally light precipitation. It is tied with April for the 4th driest month, averaging 4.38 inches of rain. Only August, September and October are drier. Afternoon and evening thunderstorms become a frequent occurrence, generally happening on 8.9 days during the month. In fact, much of the rain that falls in the month is associated with thunderstorms.
On average, measurable rain falls on 11.0 days during the month. 12.09 inches of rain fell in June 1900, which stands as the all-time record for the month. At the airport, where records have been kept for 69 years, the wettest month was June 1999, when 9.04 inches fell. Early season Gulf tropical cyclones sometimes produce heavy rounds of precipitation.
As you would expect, cloudy periods are rare. June is the second sunniest month, behind May, averaging 65% of possible sunshine. The average PM relative humidity is on the rise, at 73%, rising from the 64% observed in March. The average dewpoint reaches 67.4F, which exceeds my definition of muggy (65F). This is up from the 60.4F in May.
On June 1, the average high and low is 85/62. By June 30th, it will be 90/68 The coolest it has ever been in June is 41F on June 1, 1966. It has been as warm as 106F on June 29, 1931.
June 1st is also the start of the Atlantic Hurricane Season, which lasts until November 30th. NOAA has already come out with their forecast, and they are saying that 10 to 16 storms will be named (at least make it to tropical storm strength), 5 to 9 of those will become hurricanes, and 1 to 4 of those will become major hurricanes.
We will start off on the second name when the next name is needed for a tropical storm. Alberto was the first named storm of the season, forming on May 25th in the northern Caribbean Sea. When, and if, will Beryl form? We’ll have to wait and see.
Category: ALL POSTS, Met 101/Weather History


